Launch and Monitor
Launch
In your Home tab you have one icon for each of the applications you have access to:

- Click on the icon corresponding to the application you want to use. A new tab opens.
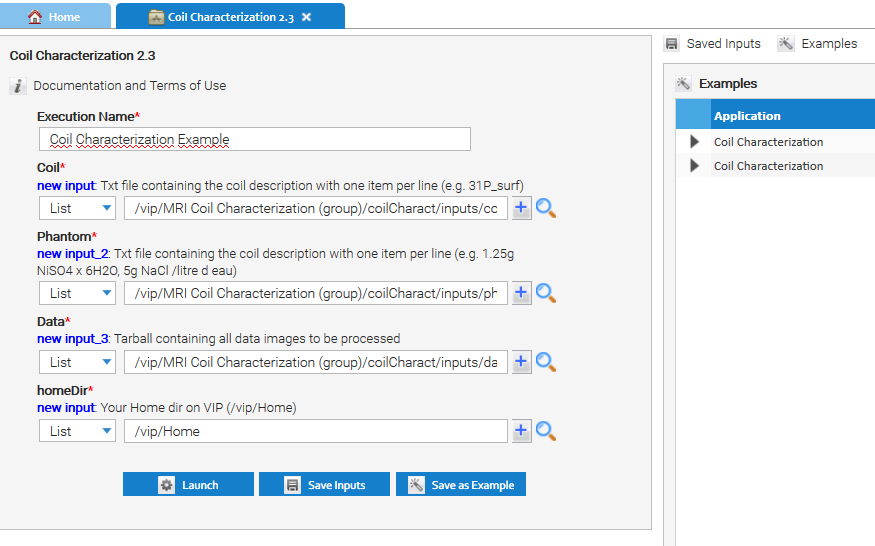
- Fill in the execution name and the application inputs. Note that you can also use the predefined inputs in the
 Examples section.
- If the inputs are files or folders, use the browse button on the right to browe the distant storage and choose the right input
- Before you launch the execution, you can use the "Save Inputs" button to save the form and reload it for a future execution
- Click on the launch button to launch the execution.
Monitor
In your Home tab you have a 'Execution Monitor' icon:
 .
.
- Click on the 'Execution Monitor' icon. A new tab with the list of all your executions opens.
- The small icon on the left gives the status of the execution.
- Green wheel = the execution is running
- Red wheel = the execution has failed
- Blue tick = the execution has completed successefully
- For each execution you can
- Click on the execution you want to monitor. The execution will open in a new tab
- Kill the execution. This will stop all the jobs and the workflow
- Clean the execution. Attention, this will delete the execution output and log files!
Monitor one simulation
- Click on the execution you want to monitor. The execution will open in a new tab
- On you left hand side, you have three available tabs
- General Information tab (default): gives access to general information, as well as on the execution logs (output and error files).
- Jobs Summary tab: list of jobs submitted by the platform. Error and stalled jobs are automatically resubmitted.
- Performance statistics: graphs and stats on executed jobs
Retrieving outputs
In the General Information tab of you execution, on the right hand side, you have access to a list (tree) of the execution's inputs and outputs.
In order to retrieve the output, simply click on the output link and download it. For more information on file transfer see also the file transfer page.